Churn modeling · Decision policy · Model serving
RetentionLab
End-to-End Customer Retention Analytics Platform
From churn prediction to retention decisions — a leakage-safe machine learning system combining calibrated risk modeling, constrained targeting, experiment design, model serving, and drift monitoring.
The decision problem
Not "predict churn" — decide who to contact
A retention team has limited outreach capacity, so the model must produce useful probabilities, prioritize customers under a budget, and support an experiment capable of measuring whether an intervention actually reduces churn. Classification accuracy alone answers none of those questions.
7,043 customers
Observational records, no treatment assignment
Predict churn probability
Gradient boosting over 19 validated features
Calibrate risk
Probabilities usable as numbers, not just ranks
Apply outreach capacity
The retention team cannot contact everyone
Rank customers
Highest predicted risk first
Target the top cohort
51.1% of churners inside the top 20%
Test with an RCT
The only way to measure a causal effect
Model performance
Measured once on a held-out split
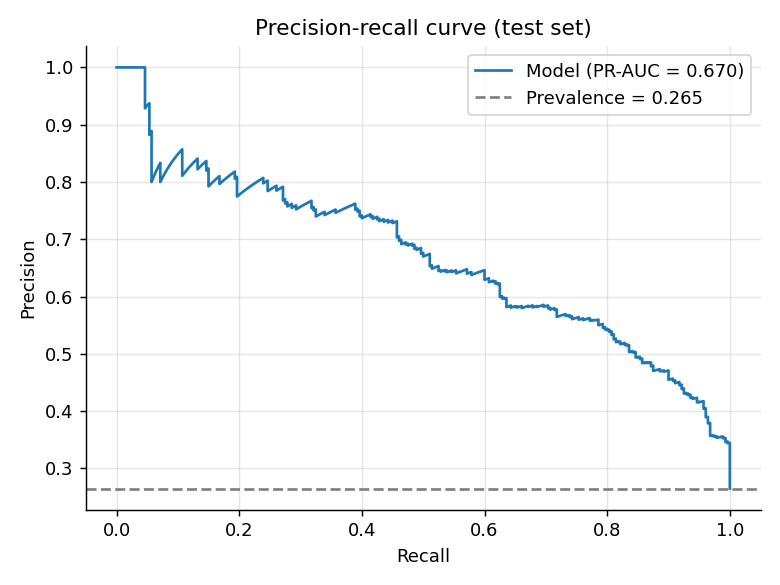
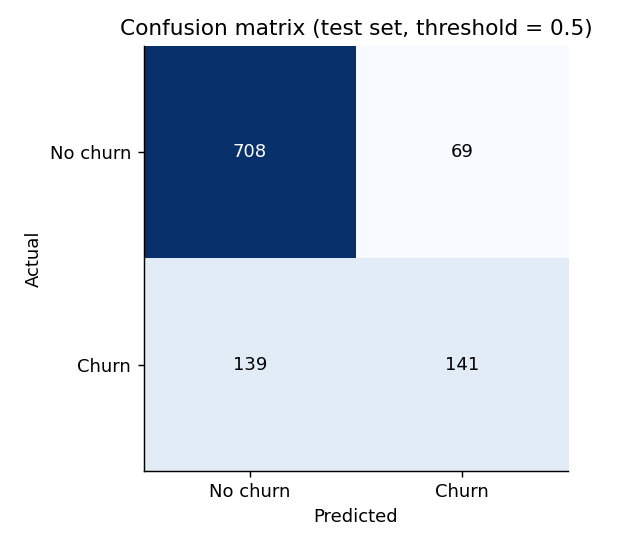
PR-AUC was the primary selection criterion because the positive churn class is substantially smaller than the retained class. Accuracy is reported but was deliberately not used to choose the model — the two metrics disagree here.
Model selection (validation split)
Chosen on PR-AUC, then Brier score.
| Model | PR-AUC | ROC-AUC | Brier |
|---|---|---|---|
| Logistic Regression | 0.628 | 0.830 | 0.1408 |
| Hist Gradient Boosting selected | 0.643 | 0.833 | 0.1392 |
Calibration (validation split)
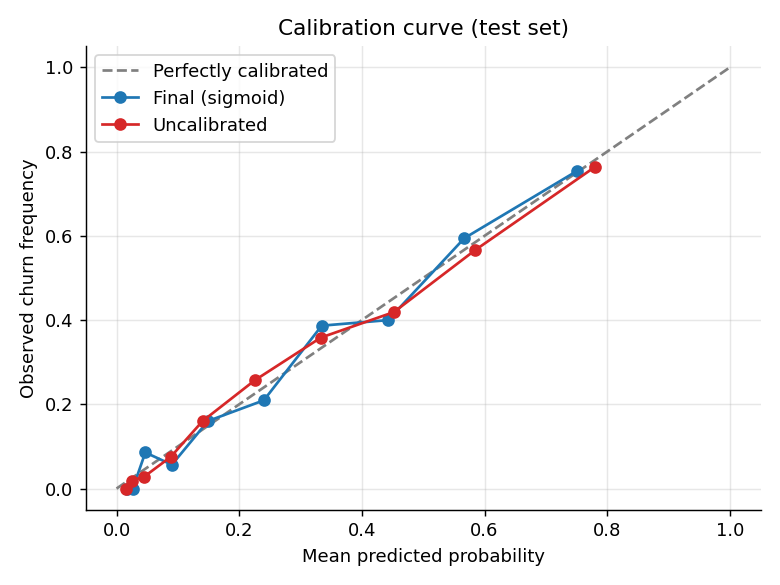
Cross-validated on training data, compared on validation. The gain is real but small, and slightly reduces PR-AUC — reported as measured.
| Variant | Brier | PR-AUC |
|---|---|---|
| uncalibrated | 0.13919 | 0.643 |
| sigmoid | 0.13809 | 0.639 |
| isotonic | 0.13819 | 0.641 |
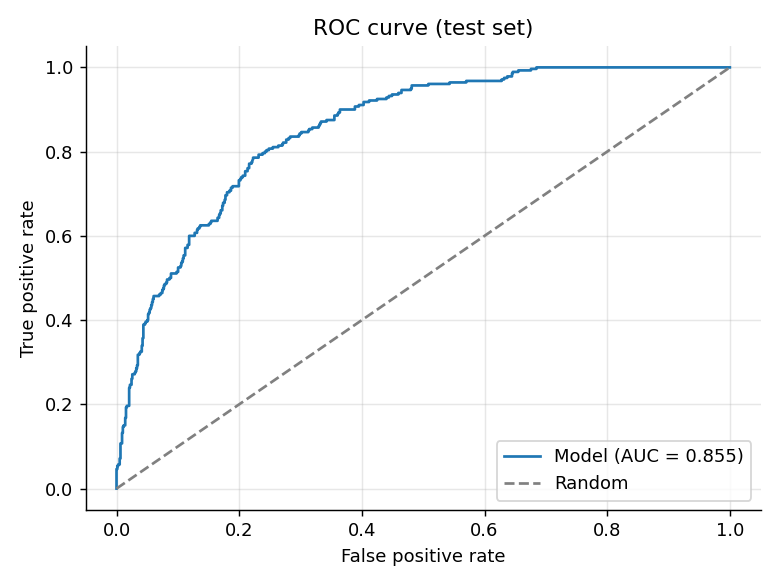
Generated diagnostics
These are the figures written by the analytical
pipeline, served directly from reports/figures/. Nothing is redrawn.
Retention policy
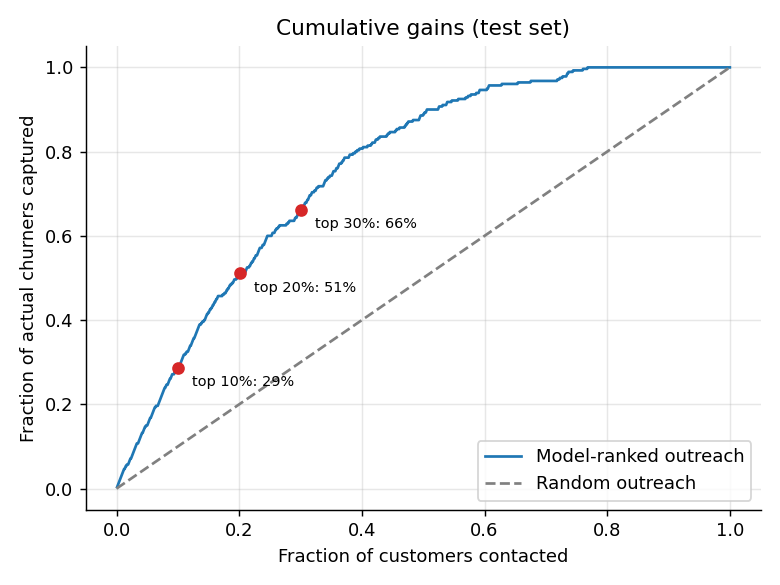
Outreach capacity versus churner capture
Customers are ranked by calibrated risk and the top slice is contacted. The marker on each bar shows what random targeting of the same size would be expected to reach.
| Capacity | Contacted | Churners caught | Capture | Precision | Lift |
|---|---|---|---|---|---|
| Top 10% | 106 | 80 / 280 | 28.6% | 75.5% | 2.85x |
| Top 20% | 212 | 143 / 280 | 51.1% | 67.5% | 2.55x |
| Top 30% | 318 | 185 / 280 | 66.1% | 58.2% | 2.20x |
Interactive demo
Score a customer against the deployed model
This form posts to the live POST /predict endpoint and renders
the response. Nothing is simulated in the browser. Inputs are generated from the service's
own Pydantic schema, so they match the 19-feature
contract exactly.
Customer
Services
Account
Derived
Computed as tenure × monthly charges so the submitted record stays internally consistent, then validated by the API.
Example customers are illustrative fictional records authored for this page, not rows from the IBM dataset, and carry no churn labels. Display bands: Lower: 0.00–0.30 Elevated: 0.30–0.60 High: 0.60–1.00 — presentation categories only, not a business decision threshold.
Capacity-constrained ranking
Rank a cohort under a fixed outreach budget
12 illustrative customers are scored and ordered by the live
POST /rank endpoint. Change the capacity to see which customers a retention team
would actually contact.
Fictional records with no churn labels: this demonstrates the ranking mechanism, not measured outcomes.
Experiment design
Prediction is not causation
The model decides whom to prioritize. A randomized experiment is still required to determine whether a retention intervention actually works. This dataset contains no treatment assignment, so the project ships a power analysis instead of an effect estimate.
System architecture
From raw records to a verified public endpoint
Two halves, one artifact: the analytical pipeline produces a frozen model, and the serving layer verifies that exact artifact before it answers a request.
Data science
ML engineering
/predict/batch-predict/rank/monitor/driftProduction engineering
What makes it a service rather than a notebook
Technology
Python 3.10.20 · scikit-learn 1.6.1 — the deployed runtime installs the same version that produced the serialized artifact. The Dockerfile is included in the repository; container execution was not verified locally.
Drift monitoring
Watching the inputs, not just the outputs
Numeric drift — Population Stability Index
Monitored: tenure MonthlyCharges TotalCharges
Incoming batches are compared against a reference profile built from the 4,929 training rows only, using fixed bins so scores stay comparable.
These are operational rules of thumb for triage, not formal statistical significance thresholds.
Categorical drift — total variation
Monitored: Contract InternetService PaymentMethod
Category distributions and missingness rates are compared against the
same training-only reference. POST /monitor/drift returns per-feature scores,
an overall status, and any warnings.
No production drift has been observed or is claimed. The endpoint scores whatever batch you send it; this project has no production traffic history.
Serving benchmark
Batch size versus p95 latency
Vectorized inference: a 500-customer batch costs roughly twice a single-customer request, not 500 times.
| Batch | Direct p50 | Direct p95 | HTTP p50 | HTTP p95 |
|---|---|---|---|---|
| 1 | 14.06 | 14.39 | 15.66 | 16.32 |
| 10 | 14.44 | 16.19 | 16.11 | 16.68 |
| 100 | 16.58 | 17.17 | 19.55 | 20.89 |
| 500 | 27.27 | 29.91 | 34.60 | 36.15 |
Inspect the system
Every claim on this page is checkable
The interactive documentation is the full request contract. The project summary endpoint returns the exact artifact-derived payload this page renders.
Engineering notes
Limitations
Stated plainly, because knowing what a result does not support is part of the result.